If you’re a trader, you know that the key to success is to consistently make profitable trades. But how do you do that? One approach that many traders use is technical analysis. In this article, we’ll take a deep dive into what technical analysis is, how it works, and how you can use it to improve your trading performance.
Table of Contents
- Introduction
- What is Technical Analysis?
- How Does Technical Analysis Work?
- Different Types of Technical Analysis
- Understanding Trends and Price Patterns
- Technical Indicators
- Moving Averages
- Support and Resistance Levels
- Fibonacci Retracements
- Bollinger Bands
- Relative Strength Index (RSI)
- Using Technical Analysis in Your Trading Strategy
- Combining Technical and Fundamental Analysis
- Risks and Limitations of Technical Analysis
- Conclusion
- FAQs
Introduction
Traders use a variety of strategies to analyze markets and make trading decisions. One of the most popular and widely used approaches is technical analysis. This involves analyzing historical market data to identify trends, patterns, and other indicators that can help predict future price movements.
While technical analysis isn’t a foolproof method for making trades, many traders believe it can be an effective tool for improving trading performance. In the following sections, we’ll take a closer look at how technical analysis works and how you can use it to your advantage.
What is Technical Analysis?
Technical analysis is a method for analyzing financial markets by examining historical price and volume data. Traders use this data to identify trends, patterns, and other indicators that can help them make trading decisions.
The goal of technical analysis is to use these indicators to predict future price movements. Technical analysts believe that market trends and patterns tend to repeat themselves over time, which means that by analyzing past data, they can identify opportunities for profitable trades in the future.
How Does Technical Analysis Work?
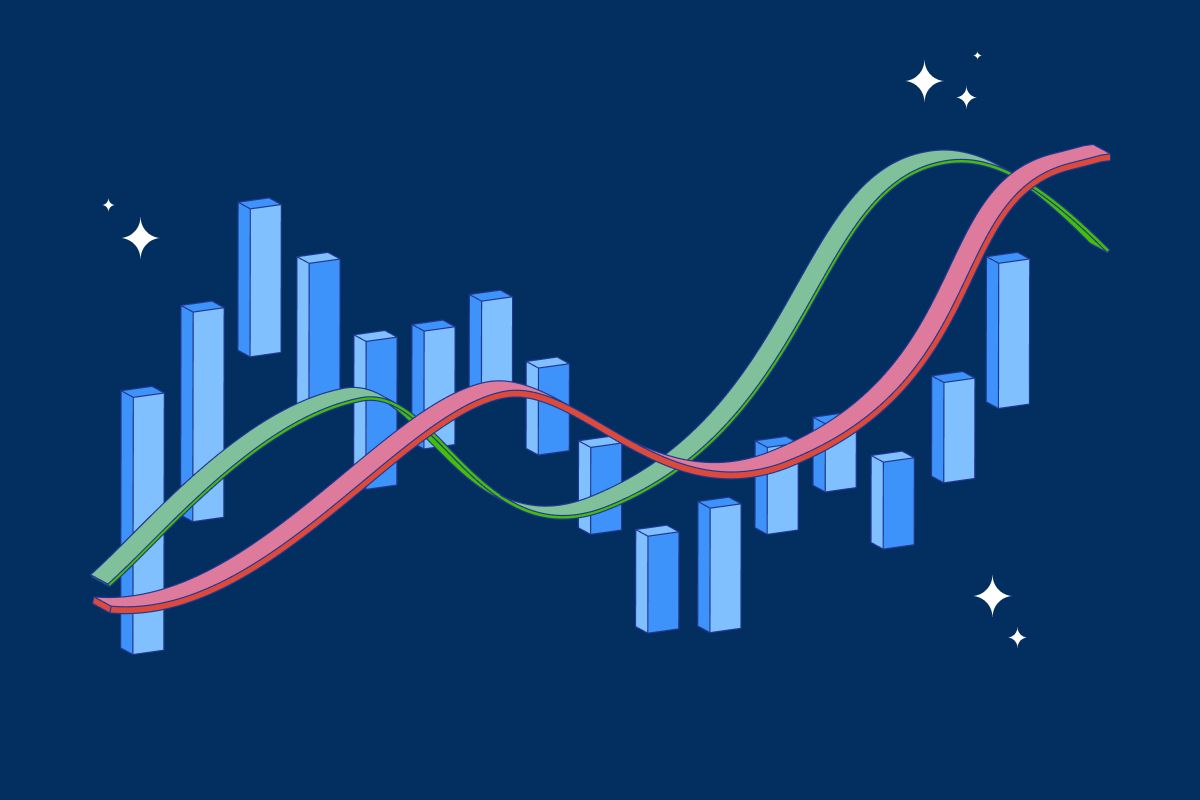
Technical analysis involves examining charts and other visual representations of market data to identify trends and patterns. Traders look for specific shapes and formations in the charts, such as triangles, head and shoulders, and flags, which can indicate bullish or bearish trends.
Technical analysts also use a variety of tools and indicators to help them interpret market data. These might include moving averages, support and resistance levels, and Fibonacci retracements, among others.
By analyzing these indicators, technical analysts can identify potential entry and exit points for trades, as well as set stop-loss and take-profit levels to manage risk.
Different Types of Technical Analysis
There are many different types of technical analysis, each with its own set of tools and indicators. Some of the most commonly used types include:
- Chart patterns: These include shapes and formations in the price charts, such as triangles, head and shoulders, and flags, which can indicate bullish or bearish trends.
- Technical indicators: These are mathematical calculations based on price and/or volume data, such as moving averages, Relative Strength Index (RSI), and Bollinger Bands.
- Wave analysis: This involves analyzing price patterns to identify trends and predict future price movements based on the Elliott Wave Theory.
- Candlestick analysis: This involves examining the patterns and shapes of candlesticks in the price charts to identify trends and potential reversal points.
Understanding Trends and Price Patterns
One of the key concepts in technical analysis is understanding trends and price patterns. Traders look for trends in the price charts, which can be either bullish (upward) or bearish (downward). They also look for patterns within these trends, such as support and resistance levels and chart formations.
By understanding these trends and patterns, traders can identify potential entry and exit points for trades. For example, if a stock is in a bullish trend, a trader might look for a pullback to a support level as a potential entry point. Conversely, if a stock is in a bearish trend, a trader might look for a resistance level as a potential exit point.
Traders also use chart patterns to identify potential price movements. For example, a head and shoulders pattern might indicate a potential reversal in a bullish trend, while a flag pattern might indicate a continuation of a trend.
Technical Indicators
Technical indicators are mathematical calculations based on price and/or volume data. Traders use these indicators to help identify potential entry and exit points for trades, as well as to manage risk.
Some of the most commonly used technical indicators include:
Moving Averages
Moving averages are calculated by taking the average price of a stock over a certain period of time. Traders use moving averages to identify trends and potential entry and exit points for trades. For example, if a stock is trading above its 50-day moving average, this might indicate a bullish trend.
Support and Resistance Levels
Support and resistance levels are price levels where traders expect buying or selling pressure to enter the market. Traders use these levels to identify potential entry and exit points for trades, as well as to set stop-loss and take-profit levels.
Fibonacci Retracements
Fibonacci retracements are based on the idea that markets tend to retrace a predictable portion of a move, after which the trend will continue. Traders use these retracement levels to identify potential entry and exit points for trades.
Bollinger Bands
Bollinger Bands are a type of technical indicator that use standard deviations to calculate upper and lower bands around a moving average. Traders use Bollinger Bands to identify potential entry and exit points for trades, as well as to set stop-loss and take-profit levels.
Relative Strength Index (RSI)
The Relative Strength Index (RSI) is a momentum indicator that measures the strength of a stock’s price action. Traders use the RSI to identify potential overbought and oversold conditions, which can indicate a potential reversal in a trend.
Using Technical Analysis in Your Trading Strategy
To use technical analysis in your trading strategy, you’ll need to become familiar with the various tools and indicators available. This might involve reading books or taking courses on technical analysis, as well as practicing your analysis on historical market data.
Once you’re comfortable with the basics of technical analysis, you can start incorporating it into your trading strategy. This might involve using technical indicators to identify potential entry and exit points for trades, or using chart patterns to predict future price movements.
It’s important to remember that technical analysis isn’t a foolproof method for making trades. Markets can be unpredictable, and no analysis method can guarantee success. However, many traders find that technical analysis can be a useful tool for improving trading performance.
Combining Technical and Fundamental Analysis
While technical analysis can be a useful tool for analyzing markets, it’s not the only approach you can take. Many traders also use fundamental analysis, which involves analyzing a company’s financial and economic data to identify potential trading opportunities.
Combining technical and fundamental analysis can give you a more complete picture of a market, which can help you make more informed trading decisions. For example, if you’re considering buying a stock based on its technical indicators, you might also want to consider the company’s financial performance to ensure it’s a sound investment.
Risks and Limitations of Technical Analysis
While technical analysis can be a useful tool for improving trading performance, it’s important to be aware of its limitations. Markets can be unpredictable, and technical analysis is not foolproof. Here are some risks and limitations to keep in mind:
False Signals
One of the biggest risks of technical analysis is the possibility of false signals. Technical indicators and chart patterns are based on historical price data, which may not necessarily predict future price movements. As a result, traders may be led to make incorrect trading decisions based on faulty signals.
Overreliance on Technical Analysis
Another risk of technical analysis is the tendency to rely too heavily on it. Traders may become so focused on technical indicators and chart patterns that they overlook important fundamental factors, such as economic data or company news.
Time and Effort
Using technical analysis effectively requires time and effort. Traders need to be able to read charts and interpret technical indicators, which can be a steep learning curve for beginners. Additionally, analyzing multiple markets or stocks can be time-consuming.
Market Volatility
Technical analysis can be less effective in highly volatile markets. Rapid price movements can make it difficult to accurately identify trends or patterns, and false signals may be more common.
Conclusion
In conclusion, technical analysis is a powerful tool for traders looking to improve their performance. By using chart patterns and technical indicators, traders can identify potential entry and exit points for trades, as well as manage risk. However, it’s important to be aware of the risks and limitations of technical analysis, and to use it in conjunction with other forms of analysis, such as fundamental analysis. With practice and patience, traders can use technical analysis to make more informed trading decisions and achieve greater success in the markets.
FAQs
- What is technical analysis? Technical analysis is a method of analyzing financial markets that uses charts, patterns, and technical indicators to identify potential price movements.
- How is technical analysis different from fundamental analysis? Fundamental analysis involves analyzing a company’s financial and economic data to identify potential trading opportunities, while technical analysis focuses on analyzing price and volume data.
- What are some common technical indicators used in technical analysis? Some common technical indicators used in technical analysis include moving averages, support and resistance levels, Fibonacci retracements, Bollinger Bands, and the Relative Strength Index (RSI).
- Can technical analysis guarantee success in trading? No analysis method can guarantee success in trading. Technical analysis is a useful tool, but traders should also consider fundamental factors and market conditions when making trading decisions.
- How can traders use technical analysis in their trading strategy? Traders can use technical analysis to identify potential entry and exit points for trades, as well as to manage risk. They can also use technical analysis to identify trends and patterns in the markets.